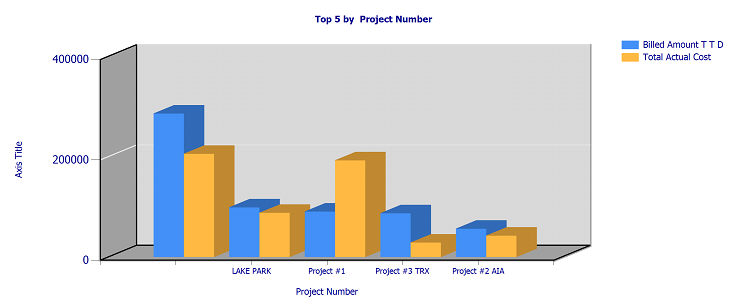
This template allows you to create a report for viewing and comparing the top X values of your choosing. There is a Show Detail drill down that shows all the records for the report.

When you create a report based on this template, you can edit the following parameters in Report Manager:
-
You can define the number of values (Top X) to display.
-
You can use any text type field from your data source to group the values on the report (Group By).
-
You can use any number type field from your data source to measure the values on the report and determine the top X groups based on this value (Chart Value 1)
-
Additionally, you can use any number type field from your data source to measure another value on the report (Chart Value 2).
Example: You may decide to use this template to create a Job Revenue Cost report. Values are grouped by Project Number, Project Name, Customer Number, Customer Name, or Estimator. Values are measured by Billed Amount TTD and Total Actual Cost.
